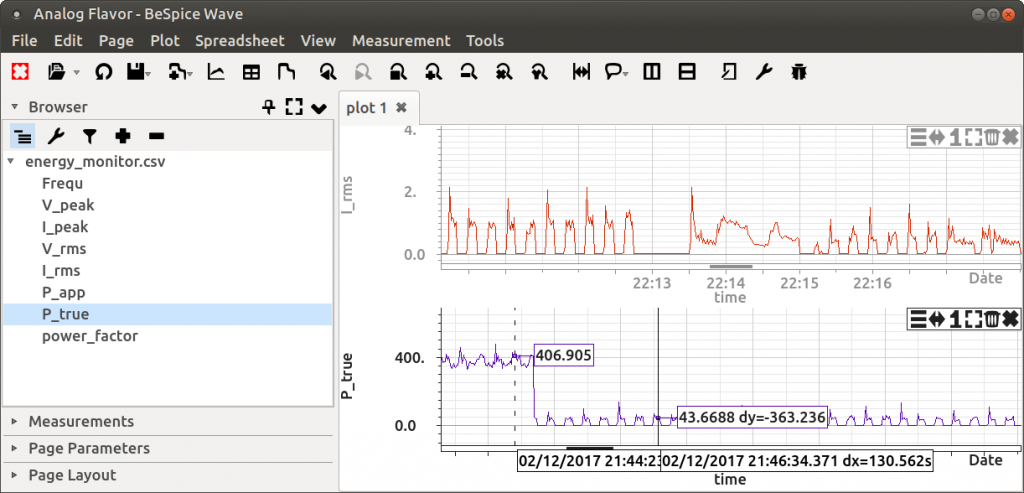
Although BeSpice Wave doesn’t collect data itself it can be used to analyze data collected by data loggers. BeSpice Wave can be used as data logger graph software as soon as the data is available from a CSV file.
Click on the “Open File” button in the tool bar to read this file. It’s columns will appear in the browser windows. Now drag one or several items from the browser to the empty notebook on the right. The data from the CSV files are shown as curves. The first column in the CSV file is interpreted as x-axis data (time points).
Use the mouse to zoom in our out and activate the cursor mode to show the curves’ values at a certain point in time.
Open several files if necessary. Files that are currently written are re-read in regular configurable intervals.
BeSpice Wave is available for testing from our downloads page or the Microsoft App Store.

